Debugging tips & tricks

Introduction : debugging locally
Debugging an application is not always easy. Almost everyone has found themselves with a terminal full of meaningless messages that we add to our code to find out what’s going on. Adding print to our code (or debug logs for the experts 😎) is not the best solution to debug your code.
If you already know what a debugger is and how it works you can skip ahead to the Live debugging part !
Logging
We could do a whole course on logging to explain how it works and how useful it is when developing your applications, but we will focus on the advantages of logging for debugging.
A logger is simply a message with several other helpful information like:
- At what time was the message created
- The name of the function that creates the message
- The PID of the process (can be helpful when debugging parallelized programs)
- …
Here is the complete list of what one can log in python.
Tips: to choose what to log as information with the logging library, you need to define a formater. Here is an example of a formater that can help you in your quest:
With this format, you will be able to see the execution time, the message, the name of the function that writes the message, the module, and even the line. If you don’t decide to use a debugger yet, I invite you to at least use the logging library and format your logs.
Debugger introduction (VS Code example)
A debugger allows for tracking the execution of a program by giving programmers better control over its implementation. You can, for example, stop the execution of a program at any time or inspect the values of variables. A debugger like VS Code even allows you to define log messages without adding a line of code (we call them log points).
The two main features of a debugger are breakpoints and data inspection.
Breakpoints: the point where our program stops. We can define several breakpoints in our code to prevent its execution at specific places that we want to inspect for debugging. We can define a series of breakpoints to stop implementing our program at different locations to execute it step by step.
Data inspection: during the execution of your program, this feature allows you to inspect the values of your variables. In our example, it can be helpful to check the value of our request.json variable when the code is stopped to make sure that its content matches our expectations. To do this, we can inspect the variables accessible in the VARIABLES tab or create a watcher in the WATCH tab:

(1) This is where you can see your breakpoints in your code.
(2) Automatic data inspector that will list all variables and their values.
(3) As your application grows, you may need to only inspect some specific values, so you can add these variables in the WATCH section.
You can find all the other available features of the VS Code debugger here
Debugger launch mode
The debugger and latter launch the process that runs the application attach to it to control its execution, or our debugger attaches to a running process. Both solutions are pretty similar. Suppose we choose to launch our program via VS Code. In that case, we have to specify how to tackle it (the attachment phase is more or less automated), or at the point of the attachment, we have to determine how to attach to the remote running application.
For our example, we decided to launch the application in standalone mode and attach it to it afterward via the debugpy library.
Live debugging in a deployed pod : when VS Code meets Kubernetes
So, the first thing we are going to need is of course VS Code (but if you are here I think you already have it installed 😉).
Making a debug-ready Flask application
We will use a straightforward flask application as an example; the app’s code is here. You can find the source code, Dockerfile, and app-deployment.yaml used to deploy everything here.
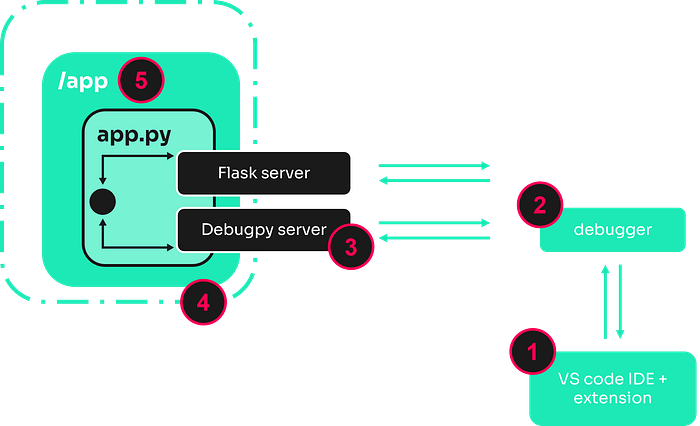
As you can see we are using the library debugpy to set up a debug listener that we will then be able to attach to after the pod’s deployment.
The way we are going to create an attached debugger (2). We do this by creating a launch.json telling VS Code where is the code (5), how to set up the debugger, and to what it should be attached (4):
So now that we set up a debugpy listener (3) in our code and created an attach debugguer launch.json, we have everything we need to be able to debug remotely! We can go to the following steps: setting up our IDE and the deployed pod on our cluster.
Setting up VS Code and the deployed pod
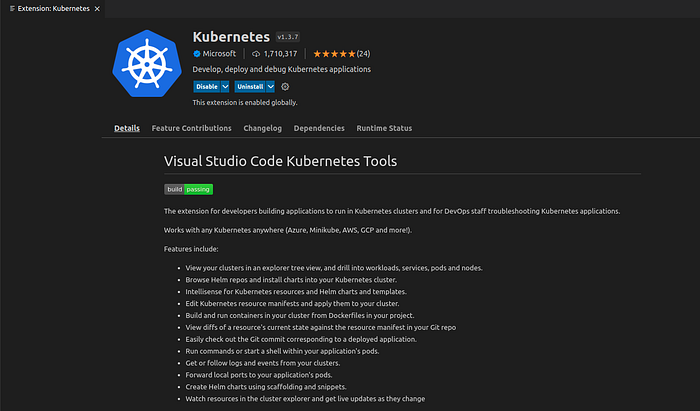
To get into business, you’ll have to install an extension allowing us to do some k8s stuff from our editor, so go ahead and install the official VS code Kubernetes extension (1).
Once you have it, let’s start deploying some stuff on our cluster !
If you are using our example app and minikube, here are some useful commands for the rest of the tutorial
So, once your app is deployed, we should now be able to find our pod in the VS Code extension.
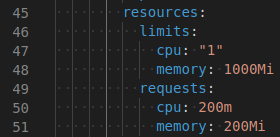
But before trying anything, let’s give it some more computing power. An IDE is always quite heavy regarding CPU and RAM usage, and since we are running VS Code on our little pod (not really, but you get the idea), it will need more resources. Otherwise, it will lag like crazy and crash.
You can run the command kubectl edit deployment mediumapp-deployment and save (ctrl + s) once you modify CPU and memory values.
It would help if you now had a pod running in your cluster with your Flask app ready to be debugged and a VS Code ready to be attached.
Start debugging
Let’s go into the Kubernetes extension, click on Clusters, Workloads, and select Pods. You should see your pod here! (If you don’t find it, check that you are in the correct namespace.)
Now click on Attach Visual Studio Code, and a new window should open! This is the VS Code instance running inside the pod. Let it load for a bit, and once it’s done, go ahead and install the Python extension (you need it to launch the debugger).
Then, move to the directory of your application in the container. In our case, it is in “/app/”. You’ll find the app’s code and, most importantly, the attached debugger.
Debugging live !
Launch the debugger how you would usually do, and there you go! The debugger is listening to the received requests and following the code execution. You can add breakpoints and use the debug console like you usually do. Here, for example, we put a breakpoint on our very naughty catch of all exceptions to try and understand what is causing the error..
If you want, you can even make code modifications directly in the container live ! You just have to modify this app by setting the debug parameter to True in your app:
app.run(host=”0.0.0.0", port=5000, debug=True)
When you save, the debugger will catch an error but just click continue and the updated version will be live ! No need to restart the pod or the container. (Just remember to rebuild the image to use it!)
Summary / conclusion
Hopefully, you know a bit more about debugging your code and how you can even do it in real-time on a deployed Kubernetes pod!
But we have barely scratched the surface of what you can do with VS Code and the options given to you to set up a debugger the way you want. Here are some helpful links if you’re going to go further:
- https://medium.com/analytics-vidhya/how-to-debug-like-a-pro-with-python-53e52552c6c2
- https://share.atelie.software/using-visual-studio-code-to-debug-a-rails-application-running-inside-a-docker-container-3416918d8cc8
- https://www.youtube.com/watch?v=0DDrseUomfU
All the code used in this article is available on Github if you want to try it out yourself (https://github.com/heka-ai/live-debugging-app).
On a final note, keep in mind that live debugging should only be done on secure networks since anyone who can connect to the specified port can execute arbitrary code within the debugged process. (ref)